


Article · Markets & Data
The Quarterly Reading, Q3 2026
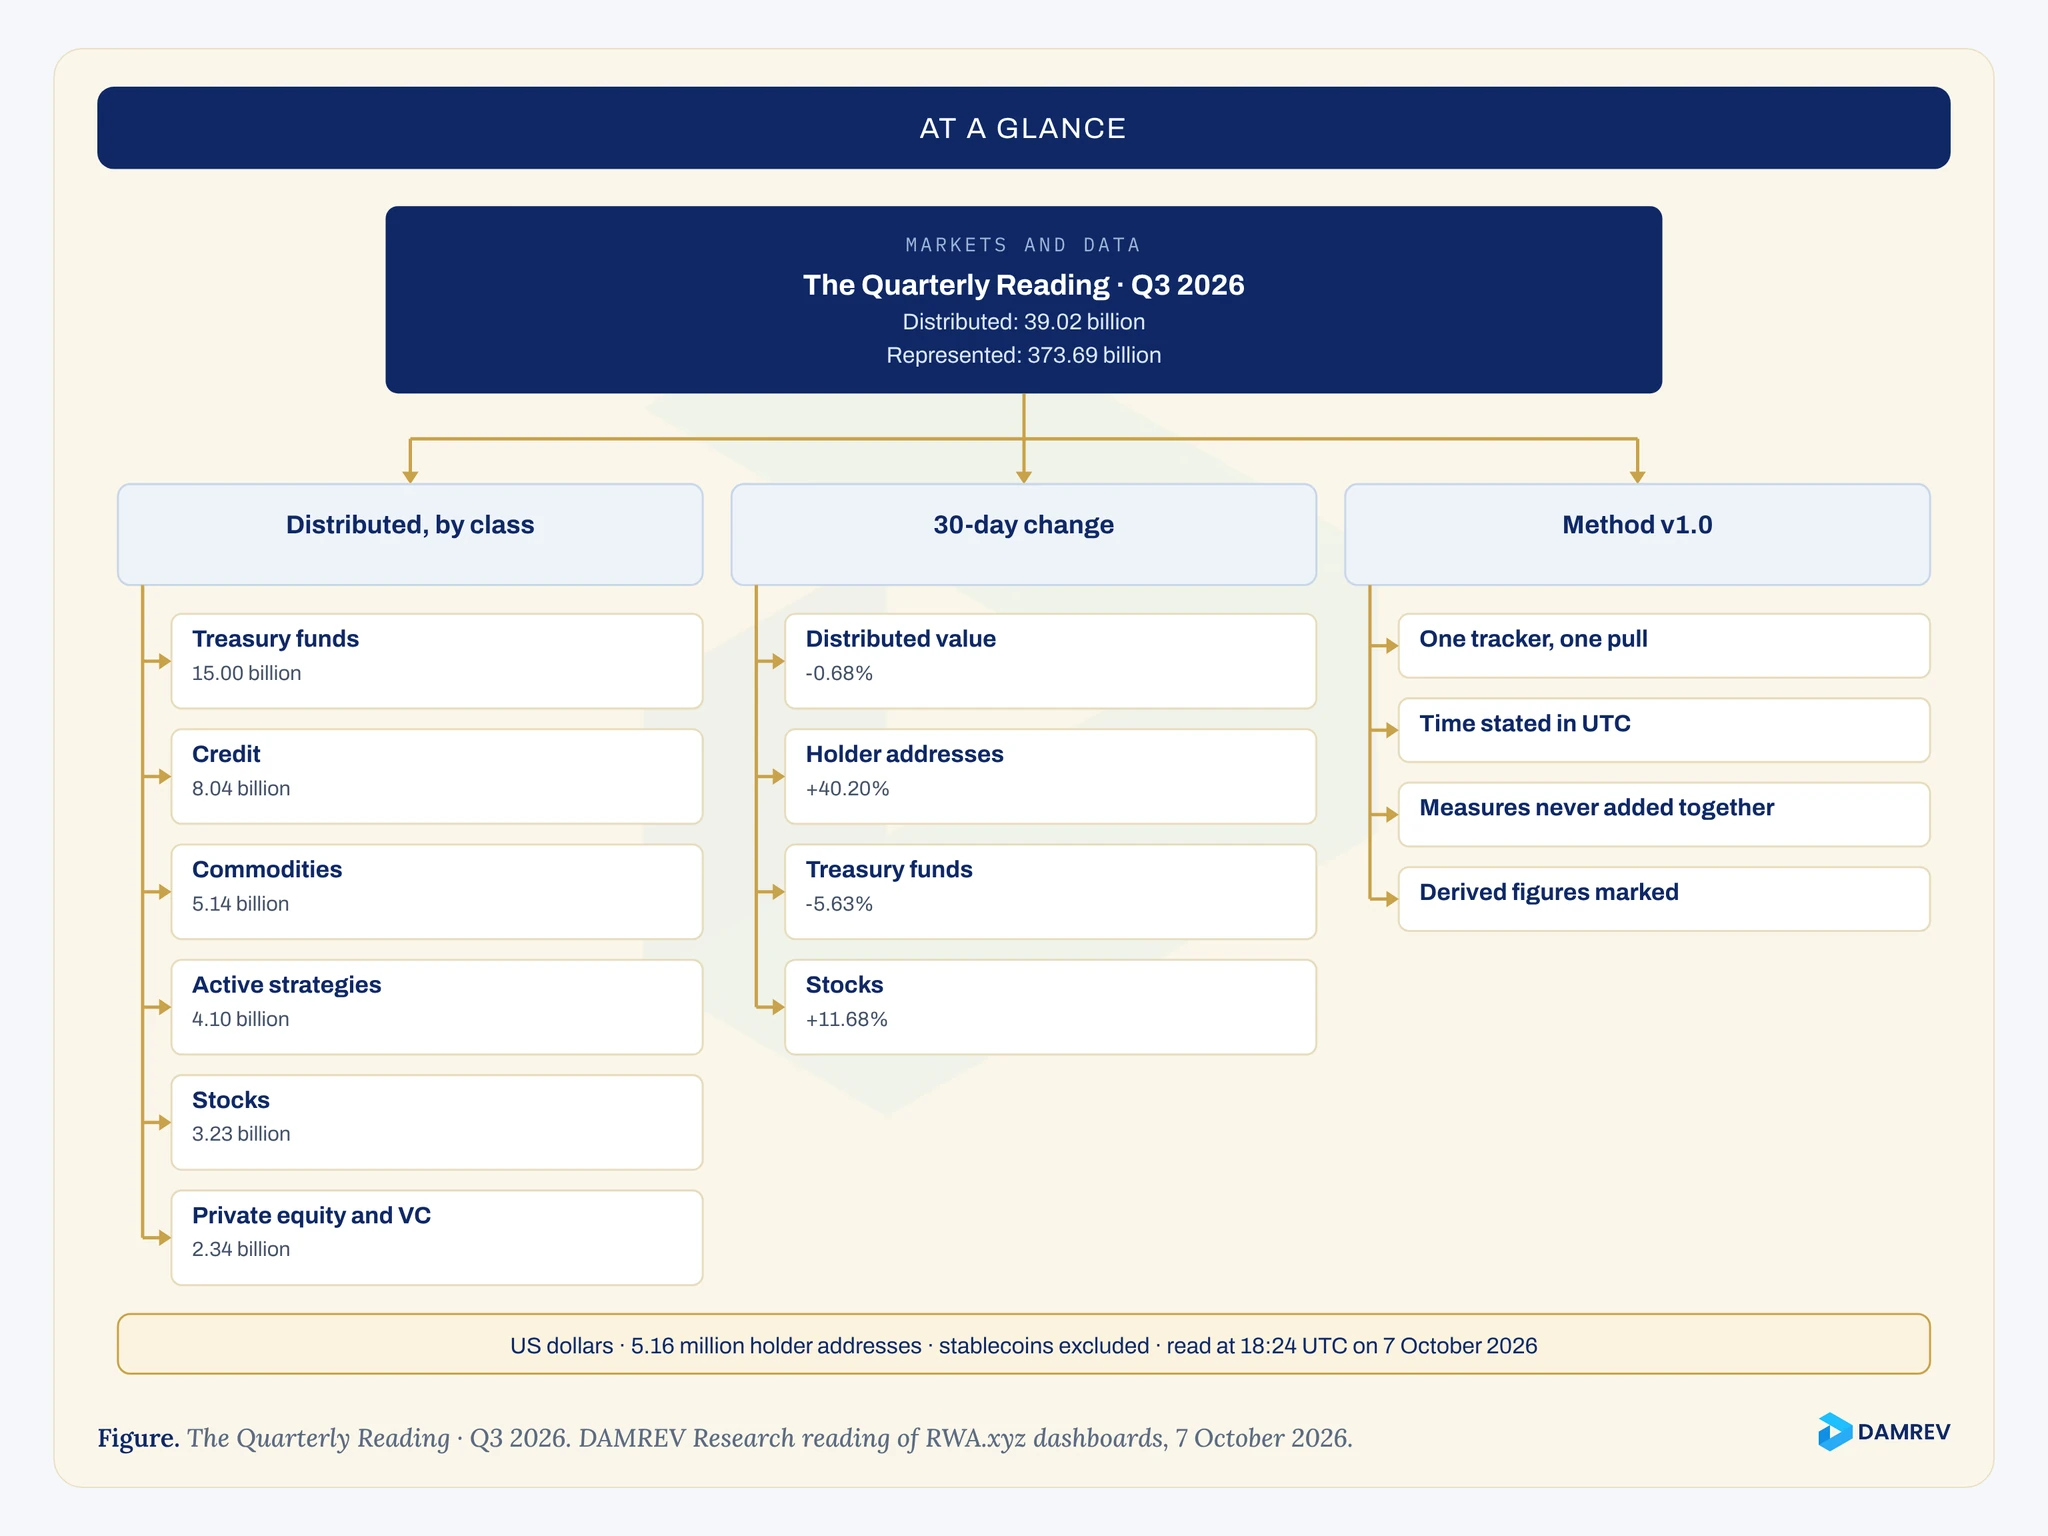
At 18:24 UTC on 7 October 2026, the first reading after the third quarter closed, tokenized assets other than stablecoins carried 39.02 billion US dollars of distributed value across 5.16 million holder addresses1.
A further 373.69 billion US dollars of represented value sits in issuers' own records, most of it in repurchase agreements; it is reported here separately and never added to the first figure1.


In this article
01 · The reading
What did the tokenized market measure after the third quarter of 2026?
On 7 October 2026 the tokenized market measured three figures, kept apart: 39.02 billion US dollars of distributed value, 373.69 billion of represented value, and 5.16 million holder addresses. Each is read from the same tracker at the same minute1.
This is the first edition of The Quarterly Reading. It states the size of the tokenized asset market on the date shown, on Method v1.0, which is published in Part 5.
Its purpose is narrow. It records what one widely cited tracker shows on a stated date, separates the two measures that tracker publishes, and says what each figure leaves out.
- Distributed value, in US dollars: tokens that can move to wallets outside the issuing platform1
- 39.02 billion
- Represented value, in US dollars: tokens recorded on a chain but kept inside the issuer's system1
- 373.69 billion
- Holder addresses across all classes, stablecoins excluded1
- 5.16 million
The first two figures are different kinds of thing. The tracker counts a token as distributed when it can be transferred between wallets outside the platform that issued it, and as represented when it cannot, by design or because of regulatory limits10.
Adding them would combine tokens that investors hold with entries that issuers keep, so this reading never adds them.
The reading was taken at 18:24 UTC on 7 October 2026, seven days after the quarter closed on 30 September. The tracker's free dashboards show current values only, so a quarter-end figure cannot be read from them after the event. The reading date is stated for that reason1.
02 · By class
How is the market divided by class?
Tokenized US Treasury funds hold 38 percent of distributed value. Credit holds most of the represented value in the published classes, and stocks hold most of the holder addresses1, 2, 3, 4, 5, 6, 7, 8, 9.
The tracker sorts assets into eight published classes, each with its own dashboard. The table gives each class's figures exactly as shown, read within one minute.
| Class | Distributed | Represented | Holder addresses | Source |
|---|---|---|---|---|
| US Treasury funds | 15.00 | 0.09 | 86,281 | 2 |
| Credit (all non-sovereign debt) | 8.04 | 37.47 | 197,880 | 3 |
| Commodities | 5.14 | 3.24 | 453,040 | 4 |
| Active strategies | 4.10 | 0.28 | 83,526 | 5 |
| Stocks | 3.23 | 0.03 | 4,300,000 | 6 |
| Private equity and venture capital | 2.34 | none shown | 7,352 | 7 |
| Non-US government debt | 0.95 | nil | 10,008 | 8 |
| Real estate | 0.23 | 1.34 | 19,380 | 9 |
| Repurchase agreements, no class page (derived, confirmed) | none | 331.24 | not shown | 1, 13 |
| Overview total | 39.02 | 373.69 | 5,159,235 | 1 |
The distributed column adds up to the overview total, so on that measure the eight classes cover the market. The represented column does not. The eight classes hold 42.45 billion US dollars between them, and the remaining 331.24 billion is our subtraction.
The tracker's table of represented platforms accounts for it exactly: one repurchase agreement platform, carrying 331,240,735,215 US dollars across 8,252 assets13. Repurchase agreements have no class page.
The holder column tells a different story from the value columns. Stocks account for about 83 percent of holder addresses and about 8 percent of distributed value1, 6. Treasury funds carry 38 percent of distributed value with under 2 percent of the addresses1, 2. A market measured by holders and a market measured by value are not the same market.
03 · 30 days
What changed in the 30 days to the reading?
In the 30 days to 7 October 2026, distributed value on RWA.xyz was nearly flat, down 0.68 percent, while holder addresses rose 40.20 percent, led by stocks and commodities. Within distributed value, Treasury funds fell 5.63 percent and stocks rose 11.68 percent1, 2, 6.
Each dashboard shows a change against its value 30 days earlier. These changes come from the tracker, not from us, and they cover the month to 7 October rather than the calendar quarter.
| Measure | 30-day change | Source |
|---|---|---|
| Distributed value, all classes | -0.68% | 1 |
| Represented value, all classes | -3.36% | 1 |
| Holder addresses, all classes | +40.20% | 1 |
| Distributed value, US Treasury funds | -5.63% | 2 |
| Distributed value, credit | +0.14% | 3 |
| Distributed value, stocks | +11.68% | 6 |
| Holder addresses, stocks | +45.00% | 6 |
| Holder addresses, commodities | +39.03% | 4 |
| Distributed value, non-US government debt | -19.65% | 8 |
Two movements stand out, and both need care. The rise in holder addresses came almost entirely from two classes, and a count of addresses can rise when one platform distributes small amounts of a token to many wallets.
The fall in Treasury fund value is a fall in value, which can reflect redemptions, transfers to a represented form, or a reclassification by the tracker, and the dashboard does not say which1, 2. This reading records the movements. It does not explain them.
04 · A second count
Does another published count agree?
An asset manager's count of 28 September 2026 broadly agrees with this reading but is not independent: it put distributed value above 39 billion US dollars and holders at just over 4.8 million, using the same tracker's data12.
The method requires each edition to read its figures against one other published count, named and dated. For this edition we used a note published by an asset manager on 28 September 2026, nine days before our reading.
It put "distributed on-chain RWA value" above 39 billion US dollars, tokenized US Treasuries and cash-equivalent products at roughly 16 billion, and the holder base at just over 4.8 million addresses, about 4.0 million of them in tokenized equities12.
Those figures sit close to ours: 39.02 billion of distributed value, 15.00 billion in Treasury funds, and 5.16 million addresses, 4.30 million in stocks1, 2, 6. The agreement says less than it seems.
The note draws its data from the same tracker, so the comparison checks our reading of the dashboards, not the dashboards themselves12. Its Treasury figure also includes cash-equivalent products that the tracker may file elsewhere.
The note is a marketing communication, and it says so. We use only its stated figures and its stated source, and none of its views12. A count built on different data, with different inclusion rules, would be the stronger test, and this edition does not have one.
05 · The method
How is the reading made?
The Quarterly Reading is made on Method v1.0, set out in the table below: one tracker, one pull, every figure timestamped, the two value measures kept apart, and every derived figure marked as ours1, 11.
The method is fixed. Method v1.0 is the method in force for this edition.
The blockchain must serve a core role in the asset's issuance, transfer, and settlement.11
| Element | Rule |
|---|---|
| Source | RWA.xyz public dashboards: the overview and each published asset class page |
| Timing | One pull, every page read within ten minutes; the time is stated in UTC |
| Measures | Distributed value, represented value, and holder addresses, each reported on its own and never added together |
| Classes | The tracker's own classes and names; a renaming or reclassification is noted in the edition that first meets it |
| Exclusions | Stablecoins, which the tracker reports separately; anything the tracker does not list |
| Derived figures | Marked as derived, with the arithmetic stated |
| Comparison | One other published count, named and dated, never blended with the reading |
| Record | The raw pull kept as a timestamped file beside each edition |
The tracker's own inclusion rule sets the outer boundary of every figure. It lists an asset only where the chain plays a core role in issuance, transfer, and settlement, and it does not list assets that are announced but not yet deployed11. Tokenized assets that fail that test are outside this reading.

06 · What it does not establish
What does this reading not establish?
As of 7 October 2026, the RWA.xyz dashboards read here do not establish the value of any asset, the number of investors, the quarter-end position, or the reasons for any change. This reading records one tracker's figures on one day1.
Not a valuation
The values are those the tracker attributes to each token. This reading does not test them, and says nothing on price, yield, or prospects.
Not a count of investors
Holder figures count addresses. The class counts add up to the overview total within rounding, which suggests that an address holding two classes is counted twice; the tracker does not say1.
Not the quarter end
The free dashboards show current values only, so this edition reads the market seven days after 30 September 2026, not on it1.
It does not establish the whole market either. Private assets recorded off-chain, assets the tracker has not listed, and anything on a ledger the tracker does not read fall outside it11. And because the tracker reclassified its figures once, in November 2025, a change in its rules can move a reading without any change in the assets10.
Common questions
What else do people ask?
Short answers on this reading: why it is dated 7 October and not 30 September, why stablecoins are left out, whether a holder is a person, and whether the method can change.
Why is this reading dated 7 October and not 30 September?
The tracker's free dashboards show current figures only, so the reading is taken on one day in the first ten days after the quarter ends, and that day is stated. This edition was read seven days after the quarter closed1.
Why are stablecoins left out?
The tracker reports them separately, and they are payment instruments rather than tokenized holdings of an underlying asset. Including them would make the total more than eight times larger1.
Is a holder a person?
No. A holder is an address that holds a token. One investor can hold several addresses, and a custodian can hold for many investors at one address1.
Can the method change?
Method v1.0 is stated in full in Part 5, with its version number and adoption date of 7 October 2026.
Where should you go next?
The pages below pick up where this one ends. Start with the one closest to where your asset or programme stands today.
- Is Private Credit the Largest Tokenized Asset Class? It Depends What You CountOn 7 October 2026 tokenized private credit held 8.04 billion US dollars of distributed value, against 15.00 billion for Treasury funds.
- How RWA Market Data Is Measured: The Trackers' Methods ComparedTrackers differ on what counts, how tokens are valued, and which wallets are left out, so totals ran from 31.76 to 77.2 billion US dollars.
- Who Holds Tokenized Assets: Holder Counts, Concentration, & What a Wallet Count HidesOn 7 October 2026 tokenized assets had 5.16 million holder addresses. An address is not an investor, so the count shows only spread.
- Tokenized or ConventionalWhere tokenized and conventional listings actually differ, and the three questions that decide which route suits your company.
References
- 1.RWA.xyz, Global Market Overview dashboard, read 7 October 2026 at about 18:23 UTC. https://app.rwa.xyz/
- 2.RWA.xyz, Tokenized U.S. Treasury Funds dashboard, read 7 October 2026 at 18:24 UTC. https://app.rwa.xyz/treasuries
- 3.RWA.xyz, Tokenized Credit dashboard, read 7 October 2026 at 18:24 UTC. https://app.rwa.xyz/credit
- 4.RWA.xyz, Tokenized Commodities dashboard, read 7 October 2026 at 18:24 UTC. https://app.rwa.xyz/commodities
- 5.RWA.xyz, Tokenized Active Strategies dashboard, read 7 October 2026 at 18:24 UTC. https://app.rwa.xyz/active-strategies
- 6.RWA.xyz, Tokenized Stocks dashboard, read 7 October 2026 at 18:24 UTC. https://app.rwa.xyz/stocks
- 7.RWA.xyz, Tokenized Private Equity and Venture Capital dashboard, read 7 October 2026 at 18:24 UTC. https://app.rwa.xyz/private-equity-venture-capital
- 8.RWA.xyz, Tokenized Non-U.S. Government Debt dashboard, read 7 October 2026 at 18:24 UTC. https://app.rwa.xyz/government-bonds
- 9.RWA.xyz, Tokenized Real Estate dashboard, read 7 October 2026 at 18:24 UTC. https://app.rwa.xyz/real-estate
- 10.RWA.xyz (Bryan Choe), "A New Framework for Tokenized Assets: Distributed & Represented", 21 November 2025. https://app.rwa.xyz/blog/a-new-framework-for-tokenized-assets-distributed-and-represented
- 11.RWA.xyz documentation, "Coverage", read 7 October 2026. https://docs.rwa.xyz/methodology/coverage
- 12.VanEck (Menno Martens), "The tokenised RWA iceberg keeps rising: from 25 billion to the edge of 40 billion US dollars", 28 September 2026. https://www.vaneck.com/nl/en/blog/digital-assets/the-tokenised-rwa-iceberg-keeps-rising-from-25-billion-to-the-edge-of-40-billion/
- 13.RWA.xyz, Tokenization Platforms page, table of represented platforms, read 7 October 2026 at 20:07 UTC. https://app.rwa.xyz/platforms
This article is analysis of public sources, not legal advice. Last updated: