


Article · Markets & Data
Is Private Credit the Largest Tokenized Asset Class? It Depends What You Count
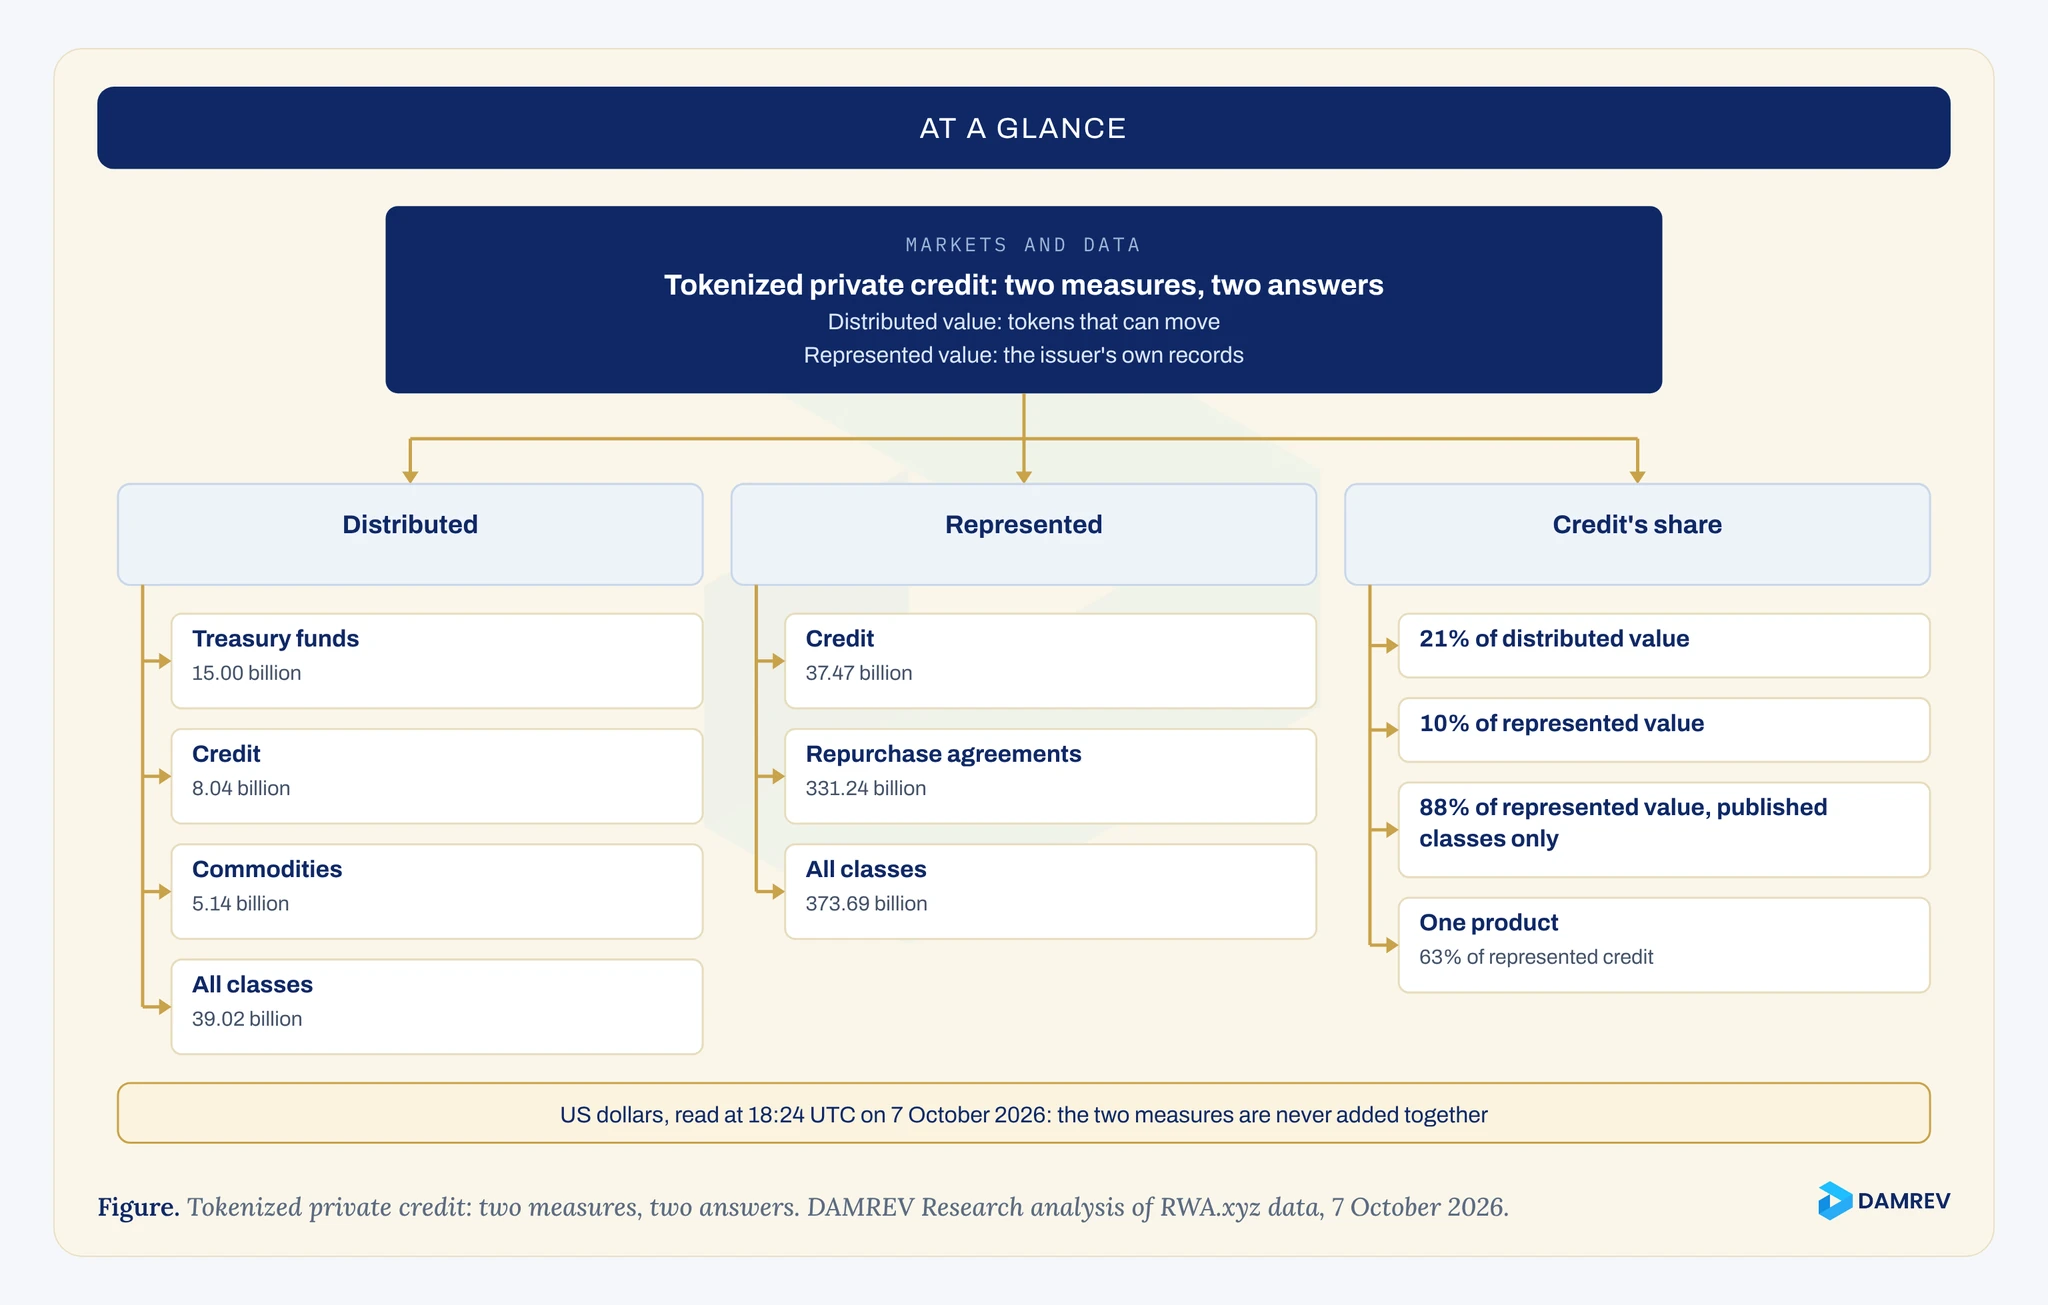
Not on the measure of tokens that investors can hold and move: on 7 October 2026 the tokenized private credit market size, as RWA.xyz counts credit, was 8.04 billion US dollars of distributed value, against 15.00 billion for tokenized US Treasury funds1, 2, 3.
Credit comes first only when represented value is counted and repurchase agreements are left out, and most of its represented value sits in one home equity product1, 2.


01 · Two measures
What do distributed and represented value count?
Distributed and represented value count different things: distributed value counts tokens that can move to wallets outside the platform that issued them, and represented value counts tokens that stay inside the issuer's own system, where the chain serves as a record10, 11.
The question in the title has no single answer because the leading tracker publishes two totals, and they measure different kinds of asset. RWA.xyz introduced the split in November 2025.
A distributed asset "can be moved to wallets outside the issuing platform", including wallets subject to whitelists or eligibility checks. A represented asset cannot be moved or transferred between wallets, by design or because of regulatory limits10, 11.
The chart on its overview page describes represented tokens as using the chain "as a recordkeeping layer" without enabling investors to transfer or hold them on-chain1.
The distinction matters to anyone using the figures. A distributed token can in principle be held in a client's own custody, pledged, or traded on a venue that admits it.
A represented token is a ledger entry that its issuer keeps, and its owner reaches it through that issuer. Both are tokenized, but only one can move between holders on a public network.
As a result, our headline market size figures may appear smaller not due to a market contraction, but because we have reclassified the following assets as Represented.10
The reclassification changed every headline that followed it. Before November 2025 a single total mixed the two. After it, the tracker's default view shows distributed value, and the represented figure sits beside it1, 10. A report that quotes one number without saying which it is cannot be compared with one that quotes the other.
02 · The reading
What did the data show on 7 October 2026?
On distributed value, Treasury funds lead with 15.00 billion US dollars and credit is second with 8.04 billion. On represented value, credit leads the published classes with 37.47 billion, but most represented value sits outside them1, 2, 3.
We read the overview and the eight asset class dashboards at 18:24 UTC on 7 October 2026. The eight distributed figures add up to the overview total of 39.02 billion US dollars, which confirms that the classes are exhaustive on that measure1, 2, 3, 4, 5, 6, 7, 8, 9.
The represented figures do not. They add up to 42.45 billion, against an overview total of 373.69 billion1.
| Class | Distributed | Represented | Source |
|---|---|---|---|
| US Treasury funds | 15.00 | 0.09 | 3 |
| Credit (all non-sovereign debt) | 8.04 | 37.47 | 2 |
| Commodities | 5.14 | 3.24 | 4 |
| Active strategies | 4.10 | 0.28 | 5 |
| Stocks | 3.23 | 0.03 | 6 |
| Private equity and venture capital | 2.34 | none shown | 7 |
| Non-US government debt | 0.95 | nil | 8 |
| Real estate | 0.23 | 1.34 | 9 |
| Repurchase agreements, no class page (derived, confirmed) | none | 331.24 | 1, 15 |
| Total, from the overview | 39.02 | 373.69 | 1 |
We first derived the gap of 331.24 billion by subtraction. The tracker's own table of represented platforms then accounts for it exactly: a single repurchase agreement platform, with 8,252 assets carrying 331,240,735,215 US dollars at 20:07 UTC15. Repurchase agreements have no class page, and a single band of them has dominated the represented chart since mid-20251.
Two further points shape the comparison. The credit class is wider than its old name suggested: the former private credit address now redirects to a page covering "all non-sovereign debt", including corporate, structured, and specialty credit2.
And the tracker lists only assets where the chain plays "a core role" in issuance, transfer, and settlement, so private credit recorded off-chain is outside every figure here12.
03 · Concentration
Why is the represented credit figure so large?
The represented credit figure on RWA.xyz is large because two assets make up most of it: a single home equity line of credit product accounts for about 63 percent of represented credit, and a mining project token labelled hybrid is the second-largest credit asset2.
The assets table on the credit dashboard ranks holdings by total value. At the time of our reading, the largest entry was a home equity line of credit product recorded on its originator's own chain, at 23.54 billion US dollars, and marked represented2. That one product is about 63 percent of the class's represented value.
- Represented value of the credit class, in US dollars, at 18:24 UTC on 7 October 20262
- 37.47 billion
- Share of that figure held by a single home equity line of credit product2
- 63%
- A copper-gold mining project token, filed as specialty finance and marked hybrid, in US dollars2
- 11.06 billion
The second-largest entry is harder to place. It is the token of a copper and gold mining project, filed under specialty finance and marked hybrid, at 11.06 billion US dollars2.
Its platform appears in the tracker's table of represented platforms, at 10.73 billion US dollars at 20:07 UTC, so it is counted in represented value, although the framework itself defines only distributed and represented11, 15. Its inclusion in a credit category also shows how wide that category has become.
The distributed figure has no comparable concentration. Its largest entry at the time was about 1.03 billion US dollars, roughly 13 percent of the class2. A reader who wants to know how much tokenized lending investors can hold and transfer should start from 8.04 billion, not 37.47 billion.
04 · The headline
Where does the claim that private credit is the majority come from?
The claim that private credit is the majority comes from neither published measure on its own: on 7 October 2026 credit is 21 percent of distributed value and 10 percent of represented value. A majority appears only if represented value is narrowed to the published classes, or if the two measures are added together with repurchase agreements left out1, 2.
The claim has circulated widely in 2026. One analysis put tokenized private credit at "roughly 54%" of on-chain value in the first quarter, against 24 percent for Treasuries, without stating which measure it used13.
A May 2026 press report of a broker's research put private credit at about 44 percent of a 51 billion US dollar market, and noted that RWA.xyz gave a lower total of 34 billion, a difference it put down to counting methods14. Neither figure can be reproduced without knowing what it counts.
We tested the claim against our reading, taking each measure on its own.
| What is counted | Credit, billions of US dollars | Total, billions of US dollars | Credit's share | Largest? |
|---|---|---|---|---|
| Distributed value, all classes | 8.04 | 39.02 | 21% | No: Treasury funds, 38% |
| Represented value, all classes | 37.47 | 373.69 | 10% | No: repurchase agreements |
| Represented value, published classes only | 37.47 | 42.45 | 88% | Yes |
On distributed value, the measure of tokens investors can hold and transfer, credit is second. On represented value it leads only once repurchase agreements are set aside, and then one product supplies most of its lead1, 2.
A share near the 54 percent headline appears when the two measures are added and repurchase agreements are left out: 45.51 billion of 81.47 billion US dollars, about 56 percent. Added across all classes, the two give credit about 11 percent.
DAMREV Research does not add them, because a sum of transferable tokens and an issuer's ledger entries describes no market a reader can hold, value, or compare. A headline built that way should say so, and the reader should know that one product drives most of the result2.

05 · What it does not establish
What does this reading not establish?
As of 7 October 2026, the RWA.xyz dashboards read here do not establish the size of private credit as lenders define it, the value of any asset, or how the figures will move. The figures are one tracker's count on one day, under that tracker's rules1, 12.
Not private credit as the industry defines it
The class covers all non-sovereign debt, and it includes only assets where the chain has a core role. Private loans recorded off-chain are not counted2, 12.
Not a valuation
The dashboards report the values the tracker attributes to each token. This article does not test them, and says nothing on price, yield, or prospects2.
Not a stable figure
The represented series moves sharply from day to day on the overview chart. A reading on another day can differ by tens of billions of US dollars1.
The figures also depend on decisions the tracker can change. It reclassified assets once, in November 2025, and its framework says represented assets that become transferable "will be reclassified as Distributed Assets"10. A reclassification of the largest home equity product, under that rule, would change the answer to the title question without any change in the underlying loans.
The question in the title is therefore a question about method. Asked of the measure that counts transferable tokens, the answer on 7 October 2026 is no. Asked of a measure that adds the issuer's own records and excludes the largest class, the answer is yes. A figure quoted without its measure answers neither.
Common questions
What else do people ask?
Short answers on the size of tokenized private credit: whether it is larger than tokenized Treasuries, how distributed and represented value differ, where the figure of more than half comes from, whether the credit category is the same as private credit, and whether other trackers give different totals.
Is tokenized private credit larger than tokenized Treasuries?
Not by distributed value. At 18:24 UTC on 7 October 2026, RWA.xyz showed 15.00 billion US dollars for tokenized US Treasury funds and 8.04 billion for credit2, 3.
What is the difference between distributed and represented value?
RWA.xyz counts a token as distributed when it can move to wallets outside the issuing platform, and as represented when it cannot, whether by design or because of regulatory limits10, 11.
Where does the figure of more than half come from?
One widely read estimate put private credit at about 54 percent of on-chain value in the first quarter of 2026 without naming its method13.
On 7 October 2026 credit is a majority only of represented value in the published classes, or of a sum of the two measures with repurchase agreements left out, which DAMREV Research does not publish as a market figure1, 2.
Is the credit category the same as private credit?
No. RWA.xyz's credit dashboard covers all non-sovereign debt, including corporate credit, structured and specialty credit, and municipal credit as well as private loans2.
Do other trackers give different totals?
Yes. A May 2026 press report of a broker's research put the whole market at 51 billion US dollars, against 34 billion from RWA.xyz at the time, and attributed the gap to counting methods14.
Where should you go next?
The pages below pick up where this one ends. Start with the one closest to where your asset or programme stands today.
- The Quarterly Reading, Q3 2026On 7 October 2026 tokenized assets other than stablecoins carried 39.02 billion US dollars of distributed value across 5.16 million holder addresses.
- How RWA Market Data Is Measured: The Trackers' Methods ComparedTrackers differ on what counts, how tokens are valued, and which wallets are left out, so totals ran from 31.76 to 77.2 billion US dollars.
- Tokenized Private Credit in a Downturn: What the Record of Defaults ShowsIn the cases on record, tokenized loans defaulted off-chain like any loan, and holders learned of losses weeks or months later, from notices.
- Advisory & StructuringSettling the asset, the claim, the vehicle, the ranking, and the control framework with your counsel before any technology.
References
- 1.RWA.xyz, Global Market Overview dashboard, distributed asset value, represented asset value, and the Total RWA Value chart (Represented view), read 7 October 2026 at about 18:23 UTC. https://app.rwa.xyz/
- 2.RWA.xyz, Tokenized Credit dashboard and assets table, read 7 October 2026 at 18:24 UTC. The former Private Credit address, app.rwa.xyz/private-credit, redirects here. https://app.rwa.xyz/credit
- 3.RWA.xyz, Tokenized U.S. Treasury Funds dashboard, read 7 October 2026 at 18:24 UTC. https://app.rwa.xyz/treasuries
- 4.RWA.xyz, Tokenized Commodities dashboard, read 7 October 2026 at 18:24 UTC. https://app.rwa.xyz/commodities
- 5.RWA.xyz, Tokenized Active Strategies dashboard, read 7 October 2026 at 18:24 UTC. https://app.rwa.xyz/active-strategies
- 6.RWA.xyz, Tokenized Stocks dashboard, read 7 October 2026 at 18:24 UTC. https://app.rwa.xyz/stocks
- 7.RWA.xyz, Tokenized Private Equity and Venture Capital dashboard, read 7 October 2026 at 18:24 UTC. https://app.rwa.xyz/private-equity-venture-capital
- 8.RWA.xyz, Tokenized Non-U.S. Government Debt dashboard, read 7 October 2026 at 18:24 UTC. https://app.rwa.xyz/government-bonds
- 9.RWA.xyz, Tokenized Real Estate dashboard, read 7 October 2026 at 18:24 UTC. https://app.rwa.xyz/real-estate
- 10.RWA.xyz (Bryan Choe), "A New Framework for Tokenized Assets: Distributed & Represented", 21 November 2025. https://app.rwa.xyz/blog/a-new-framework-for-tokenized-assets-distributed-and-represented
- 11.RWA.xyz documentation, "Tokenization type", read 7 October 2026. https://docs.rwa.xyz/frameworks/tokenization-type
- 12.RWA.xyz documentation, "Coverage", read 7 October 2026. https://docs.rwa.xyz/methodology/coverage
- 13.BlockEden, "Tokenized private credit is 54 percent of RWA", 4 May 2026. https://blockeden.xyz/blog/2026/05/04/tokenized-private-credit-54-percent-rwa-apollo-centrifuge-maple/
- 14.Cointelegraph, report of Bernstein research on the tokenized asset market, 26 May 2026. https://cointelegraph.com/news/rwa-market-cap-51-billion-tokenized-private-credit-bernstein
- 15.RWA.xyz, Tokenization Platforms page, table of represented platforms, read 7 October 2026 at 20:07 UTC. https://app.rwa.xyz/platforms
This article is analysis of public sources, not legal advice. Last updated: