


Article · Markets & Data
Why Tokenization Forecasts Disagree
Tokenization market size forecasts disagree mostly because they do not count the same thing.
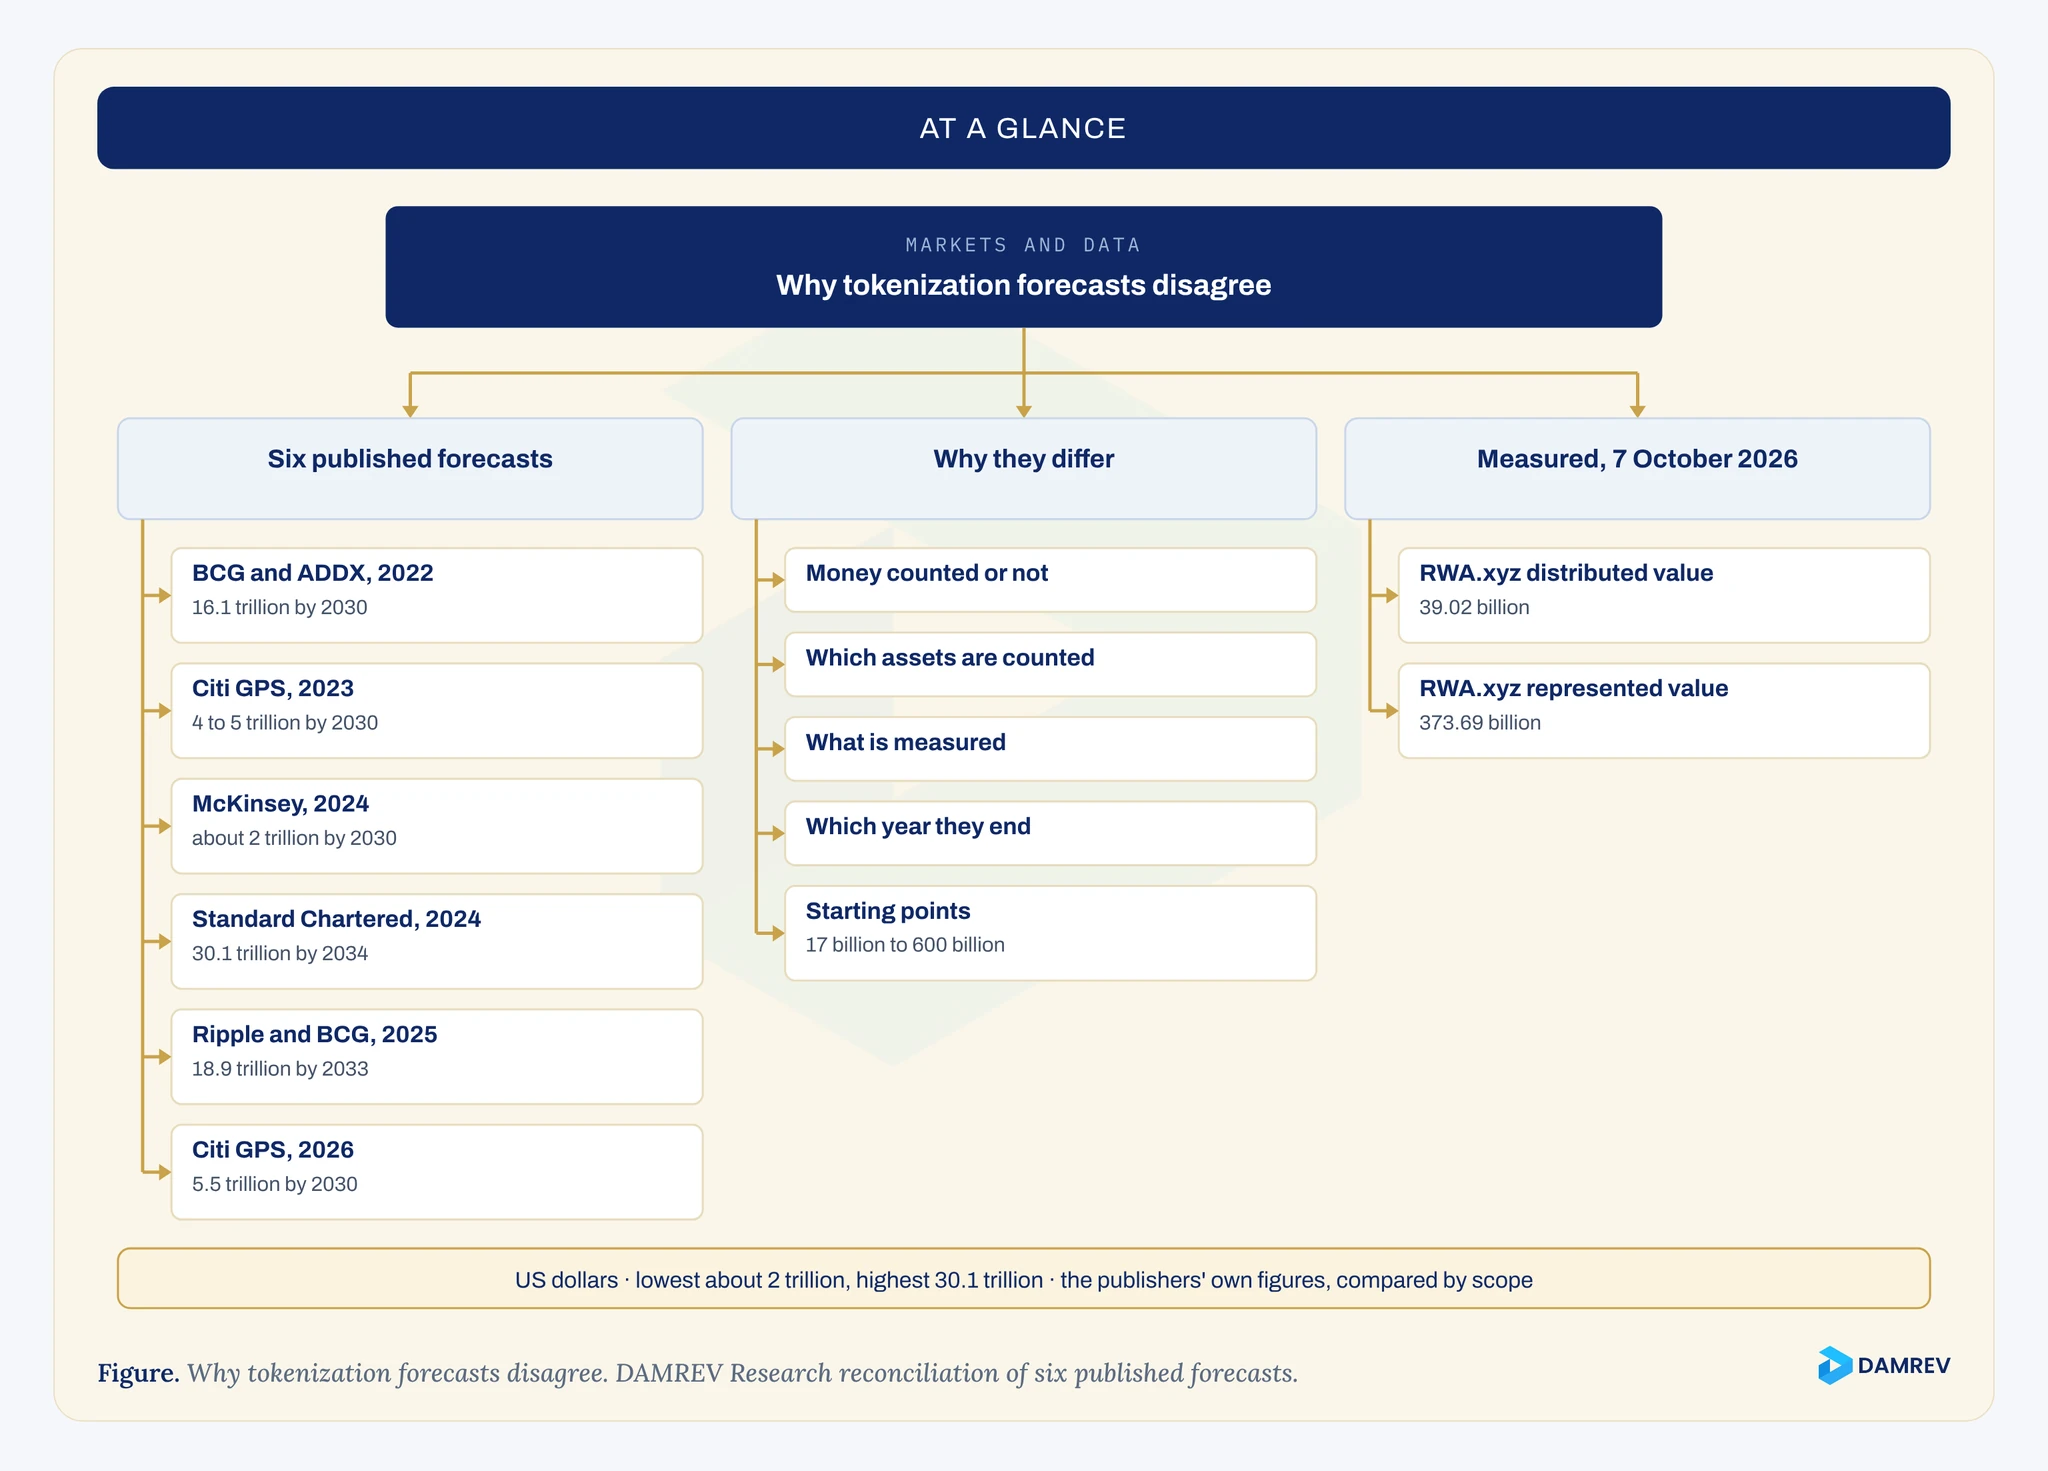
Six of the most cited range from about 2 trillion US dollars by 2030 to 30.1 trillion by 2034, and they differ on whether stablecoins and deposits are in, which assets are counted, what is being measured, and which year they end1, 2, 3, 4, 5, 6.
Their starting points differ too, from about 17 billion to about 600 billion US dollars5, 6.


In this article
01 · The spread
How far apart are the forecasts?
Six of the most cited tokenization forecasts are about 15-fold apart, putting the tokenized market at between about 2 trillion US dollars by 2030 and 30.1 trillion by 2034. On 7 October 2026 one tracker measured 39.02 billion of distributed value3, 4, 7.
Forecasts of the tokenized asset market are quoted more often than any measured figure, and they disagree by an order of magnitude. This article puts six of the most cited into one table, built from their own pages, and records what each one counts.
- The lowest base-case forecast here, in US dollars by 2030, excluding stablecoins and deposits3
- About 2 trillion
- The highest, in US dollars by 2034, with its measure not stated in the public release4
- 30.1 trillion
- Distributed value measured by RWA.xyz at 18:24 UTC on 7 October 2026, in US dollars7
- 39.02 billion
We chose the six by how often they are cited in coverage of the market, and kept to forecasts whose publisher's own page or report we could read. Two came from the same consulting firm, three years apart and with different co-publishers, and two from the same bank's research arm, also three years apart.
02 · The reconciliation
What does each forecast count?
The six forecasts count different things. Only one excludes stablecoins and deposits from its total in terms and explains why; two project money separately; one counts both as tokenized assets; one is led by listed shares and Treasuries; one stresses trade finance; and three do not define the figure they forecast1, 2, 3, 4, 5, 6.
The table is ours. Each cell comes from the forecast's own page or report, read on 7 October 2026. Where the source does not say, the cell says so, rather than filling the gap from commentary.
| Forecast | Horizon and base case | Measure as stated | Stablecoins and deposits | What it counts | Source |
|---|---|---|---|---|---|
| Boston Consulting Group (BCG) and ADDX, September 2022 | 16.1 trillion by 2030; 68 trillion best case | A "business opportunity", not defined | Not stated; crypto excluded | Real estate, equities, bonds, funds, car fleets, patents | 1 |
| Citi GPS, March 2023 | 4 to 5 trillion by 2030 | "Tokenized digital securities" | Projected separately, with central bank money, at up to 5 trillion | Assumed shares of corporate and quasi-sovereign bonds, real estate funds, private equity and venture funds, and repo and collateral; trade finance volumes shown separately | 2 |
| McKinsey, June 2024 | About 2 trillion by 2030; range 1 to 4 trillion | Tokenized market capitalisation | Excluded, with tokenized deposits and central bank money | Funds, bonds, loans and securitization, alternative funds | 3 |
| Standard Chartered and Synpulse, June 2024 | 30.1 trillion by 2034 | Not stated in the public release | Not stated | Trade finance about 16 percent; others not stated | 4 |
| Ripple and BCG, April 2025 | 18.9 trillion by 2033; range 12.5 to 23.4 trillion | "Volumes of assets being tokenized" | Both counted as asset classes; central bank money and crypto excluded | Deposits, stablecoins, funds, fixed income, equities, credit, real estate, and others; China and Russia excluded | 5 |
| Citi GPS, June 2026 | 5.5 trillion by 2030; range 2.7 to 8.2 trillion | Not defined on the page | Stablecoins projected separately; deposits treated as settlement | Led by listed shares and US Treasuries | 6 |
Read across a row and each figure becomes intelligible. Read down a column and they stop being comparable. The Ripple and BCG forecast to 2033 counts bank deposits held as tokens; the McKinsey forecast to 2030 excludes them by design.
One forecast's growth comes from listed shares, another's from trade finance, a third's from funds and loans. Three do not say what their headline figure measures at all1, 4, 6.
The measure matters as much as the scope. A stock is the value of tokenized assets outstanding on a date. A flow is the value passing through in a year, such as trade finance volumes or repurchase agreements settled on a ledger.
Citi's 2023 paper kept them apart: it gave about 1 trillion US dollars of ledger-based trade finance volumes separately from its 4 to 5 trillion of securities, which it built from assumed tokenized shares of each market, such as 1 percent of corporate and quasi-sovereign bonds and 10 percent of private equity and venture funds2.
Adding a flow forecast to a stock forecast, or comparing one with the other, produces a number that measures neither.
03 · Money in or out
Does it matter whether money is counted?
Whether money is counted matters more than any other choice, because stablecoins and tokenized deposits are the cash side of tokenized trades. Counting them adds a large, fast-growing block; leaving them out measures only the assets being paid for3, 5.
The sharpest division in the table is over money. The McKinsey forecast sets it aside and says why.
Our estimate is exclusive of stablecoins, including tokenized deposits, wholesale stablecoins, and central bank digital currencies (CBDCs) to avoid double counting, as these are often used as the corresponding cash legs in the settlement of trades involving tokenized assets.3
The Ripple and BCG forecast takes the opposite course. Its breakdown lists deposits and stablecoins alongside funds, bonds, and real estate as asset classes being tokenized5.
Neither approach is wrong. They answer different questions: how much of the world's financial assets will be held as tokens, against how much will be held as tokens including the money used to buy them.
The difference is not small. On 7 October 2026 RWA.xyz showed 295.83 billion US dollars of stablecoins, reported separately from its 39.02 billion of distributed tokenized assets7. On that day, stablecoins alone were more than seven times the distributed asset figure.
Citi's 2026 forecast takes a middle course. It projects stablecoins separately, at 1.9 trillion US dollars by 2030, and describes stablecoins and tokenized deposits as settlement infrastructure rather than as part of its 5.5 trillion6. A reader who adds the two figures together is adding a forecast of assets to a forecast of money.
04 · Different starting points
Why do the starting points differ so much?
The starting points of tokenization forecasts differ because each forecast measures today's market on its own definition. Stated starting points run from about 17 billion US dollars in 2026 to about 600 billion in 2025, and a forecast inherits whatever its starting point includes5, 6.
A forecast is a starting value multiplied by assumed growth. If two forecasts disagree about the present, they will disagree about the future even with identical assumptions. The sources state very different presents.
| Source | Date | Starting point, US dollars | What it includes | Source |
|---|---|---|---|---|
| BCG and ADDX | 2022 | 310 billion | Its own definition; crypto excluded | 1 |
| Ripple and BCG | 2025 | About 600 billion | Includes deposits and stablecoins | 5 |
| Citi GPS | 2026 | About 17 billion | "The current global tokenized asset market", not further defined | 6 |
| RWA.xyz, distributed value | 7 October 2026 | 39.02 billion | Transferable tokens; stablecoins excluded | 7 |
| RWA.xyz, represented value | 7 October 2026 | 373.69 billion | Issuers' own records, mostly repurchase agreements; reported separately | 7 |
The Ripple and BCG starting point of about 600 billion US dollars is about 15 times the distributed value measured in October 2026. It is reachable only by counting the money and records that the narrower measures leave out5, 7.
Citi's 2026 figure of about 17 billion is below the tracker's distributed figure, which suggests a narrower definition still, though the page does not give one6.
The horizons differ as well. Three of the six end in 2030, one in 2033, and one in 2034. Three or four extra years of assumed growth can account for much of the gap between the largest figures and the rest, before any difference of view4, 5.

05 · What it does not establish
What does this reconciliation not establish?
As of 7 October 2026, the six forecasts and the RWA.xyz figures read here do not establish which forecast is right, what the market will be, or how any forecast was modelled beyond what its publisher states. This reconciliation shows what each counts, and so why they cannot be ranked against each other1, 2, 3, 4, 5, 6.
Not a forecast of our own
This article makes no prediction. The figures are the publishers' own, and the comparison is of scope, not of likelihood.
Not a full model review
Two of the six publish their full method only in papers we did not read in full for this table, and the cells say so where a point was not stated2, 4.
Not neutral sources
Several publishers sell services in the market they forecast. That is a reason to read their scope closely, and the article draws no conclusion about their motives.
Three forecasts do not define their headline figure on the pages we read, and one gives two different bull-case figures on the same page, 8.2 trillion in its text and 8 trillion in its summary1, 4, 6.
Those gaps are part of the finding. A forecast that does not say what it measures cannot be checked, even when its year arrives.
A tokenization forecast can be compared only when four facts are stated: whether stablecoins and deposits are in, which assets are counted, whether the figure is a stock or a flow, and the year it ends.
Common questions
What else do people ask?
Short answers on the forecasts: which one is right, why the 18.9 trillion forecast is so much larger than the 2 trillion one, how large the market is today, and whether the forecasts include cryptocurrencies.
Which tokenization forecast is right?
None can be checked yet, and they are not rival answers to one question. Each counts a different set of assets, on a different measure, to a different year1, 2, 3, 4, 5, 6.
Why is the 18.9 trillion forecast so much larger than the 2 trillion one?
Among other things, the larger forecast counts deposits and stablecoins as tokenized assets and runs three years longer. The smaller excludes both, to avoid counting the cash side of each trade3, 5.
How large is the tokenized market today?
On RWA.xyz at 18:24 UTC on 7 October 2026, 39.02 billion US dollars of distributed value, with 373.69 billion of represented value and 295.83 billion of stablecoins reported separately7.
Where should you go next?
The pages below pick up where this one ends. Start with the one closest to where your asset or programme stands today.
- Is Private Credit the Largest Tokenized Asset Class? It Depends What You CountOn 7 October 2026 tokenized private credit held 8.04 billion US dollars of distributed value, against 15.00 billion for Treasury funds.
- How RWA Market Data Is Measured: The Trackers' Methods ComparedTrackers differ on what counts, how tokens are valued, and which wallets are left out, so totals ran from 31.76 to 77.2 billion US dollars.
- The Quarterly Reading, Q3 2026On 7 October 2026 tokenized assets other than stablecoins carried 39.02 billion US dollars of distributed value across 5.16 million holder addresses.
- Tokenized or ConventionalWhere tokenized and conventional listings actually differ, and the three questions that decide which route suits your company.
References
- 1.BCG and ADDX, "Relevance of on-chain asset tokenization in 'crypto winter'", 12 September 2022. https://addx.co/files/bcg_ADDX_report_Asset_tokenization_trillion_opportunity_by_2030_de2aaa41a4.pdf
- 2.Citi GPS, "Money, Tokens and Games: Blockchain's Next Billion Users and Trillions in Value", March 2023. https://ir.citi.com/gps/MG9DEWhoYvQJVWLM9Kr3%2BZmqjoztKJcyNHr83F9Wug2pzAGHPQKfp23RAMrkNts%2FJitXoTNqufOvegUjjXh0IA%3D%3D
- 3.McKinsey & Company, "From ripples to waves: The transformational power of tokenizing assets", 20 June 2024. https://www.mckinsey.com/capabilities/tech-and-ai/our-insights/from-ripples-to-waves-the-transformational-power-of-tokenizing-assets
- 4.Synpulse, "Trade finance to play substantial role in USD 30.1 trillion tokenised real-world assets market by 2034", press release on the Standard Chartered and Synpulse paper, 27 June 2024. https://synpulse.com/en/insights/trade-finance-to-play-substantial-role-in-usd-30-1-trillion-tokenised-real-world-assets-market-by-2034
- 5.Ripple and Boston Consulting Group, "Approaching the Tokenization Tipping Point", 7 April 2025. https://media-publications.bcg.com/Tokenized-Assets.pdf
- 6.Citi GPS, "Tokenization 2030", 1 June 2026. https://citigroup.com/global/insights/tokenization-2030
- 7.RWA.xyz, Global Market Overview dashboard, read 7 October 2026 at about 18:23 UTC. https://app.rwa.xyz/
This article is analysis of public sources, not legal advice. Last updated: